Line Chart
Data points with straight lines, representing changes or trends over time or categories.
LineChart
Defines the overall structure of a line chart component within a report.
id- A literal string with the value "line", identifying the component as a line chart.title- An optional string representing the title of the line chart.data- An instance ofLineChartData, representing the data sets to be visualized in the line chart.
LineChartData
Defines an array of SingleLineData objects, where each object represents a data set for the line chart. At least one data set is required.
SingleLineData
Defines the structure of a single data set within a line chart.
x- An array of strings representing the categories or intervals on the x-axis.y- An array of numbers representing the values corresponding to each category or interval on the x-axis.label- An optional string representing the label for the data set.
Example
{
"id": "line",
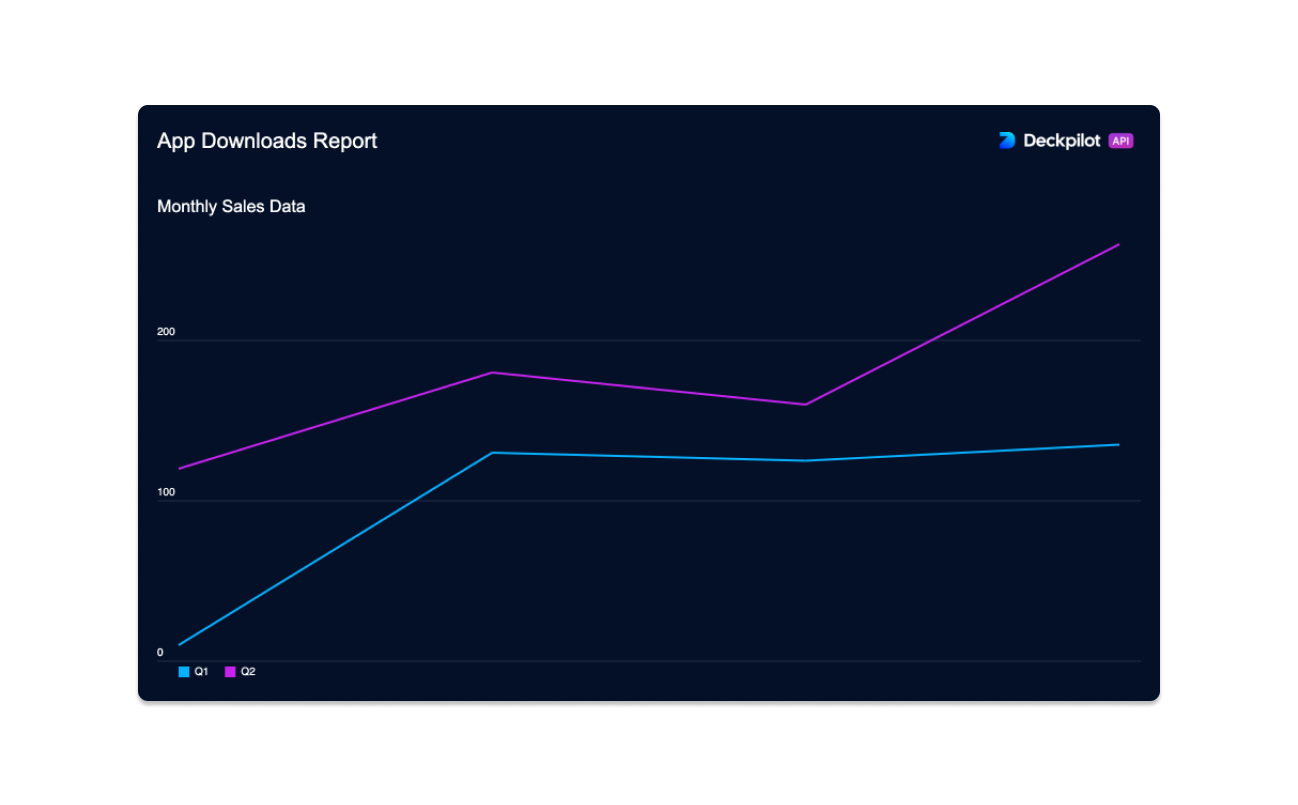
"title": "Monthly Sales Data",
"data": [
{
"x": ["January", "February", "March", "April"],
"y": [10, 130, 125, 135],
"label": "Q1"
},
{
"x": ["January", "February", "March", "April"],
"y": [120, 180, 160, 260],
"label": "Q2"
}
]
}