Grouped Bar Chart
Comparative data across categories with bars grouped by category, allowing for an intuitive comparison of segments within each category.
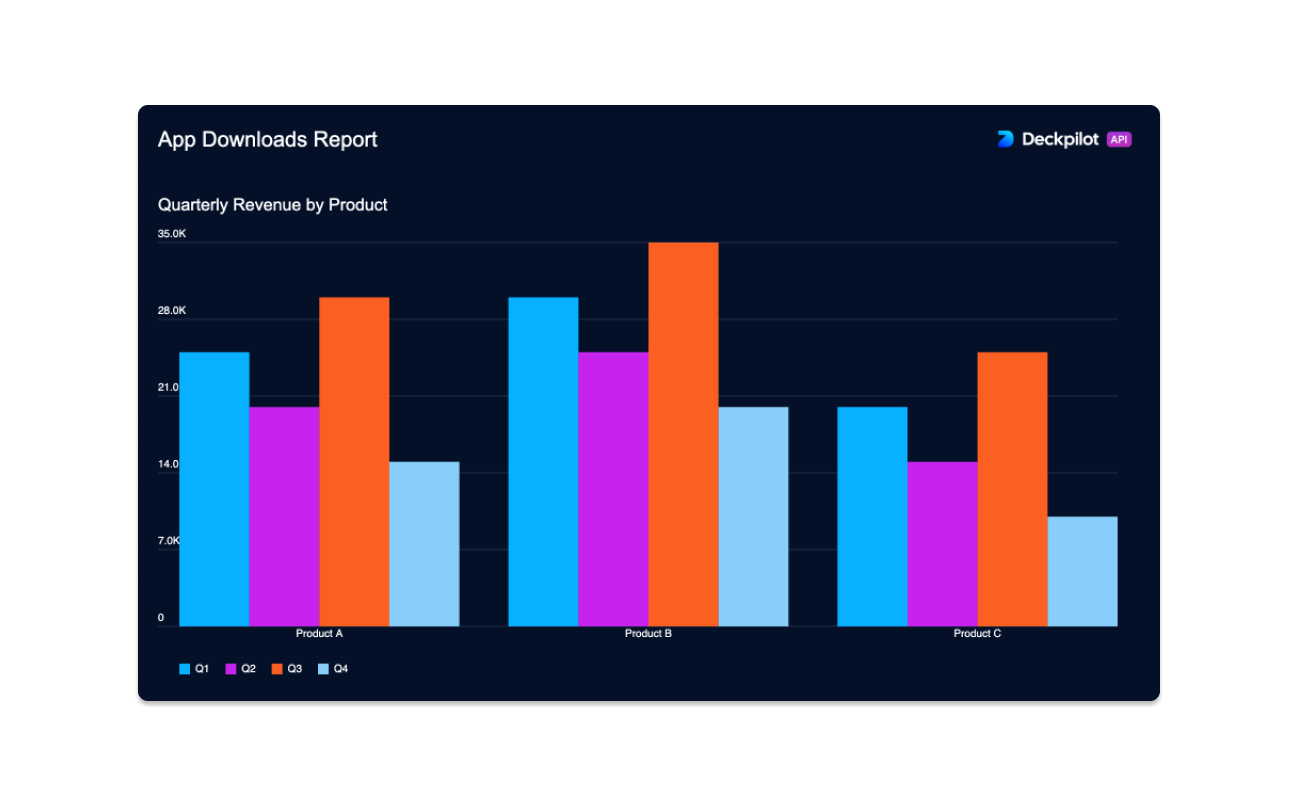
GroupedBarChart
Defines the overall structure of a grouped bar chart component within a report.
id- A literal string with the value "groupedBar", identifying the component as a grouped bar chart.title- An optional string representing the title of the grouped bar chart.data- An instance ofGroupedBarChartData, representing the sets of data to be visualized in the grouped bar chart.segmentLabels- An array of strings representing labels for each segment within the groups. The number of labels should match the maximum number of segments in any group.
GroupedBarChartData
Defines an array of objects, where each object represents a category with its segments for the grouped bar chart.
label- A string representing the name of the category or group.segments- An array of numbers representing the value of each segment within the group. The number of segments is limited to a maximum of 5 per group to ensure clarity and readability.
Example
{
    "id": "groupedBar",
    "title": "Quarterly Revenue by Product",
    "data": [
        {
            "label": "Product A",
            "segments": [25000, 20000, 30000, 15000]
        },
        {
            "label": "Product B",
            "segments": [30000, 25000, 35000, 20000]
        },
        {
            "label": "Product C",
            "segments": [20000, 15000, 25000, 10000]
        }
    ],
    "segmentLabels": ["Q1", "Q2", "Q3", "Q4"]
}