Simple Bar Chart
Simple, individual bars for each category, making it easy to visualize and compare the value of each category at a glance.
SimpleBarChart
Defines the overall structure of a simple bar chart component within a report.
id- A literal string with the value "simpleBar", identifying the component as a simple bar chart.title- An optional string representing the title of the simple bar chart.data- An instance ofSimpleBarChartData, representing the categories and their corresponding values to be visualized in the bar chart.
SimpleBarChartData
Defines an array of objects, each representing a category and its associated value for the simple bar chart.
label- A string representing the name of the category.value- A number representing the value associated with the category.
Example
{
"id": "simpleBar",
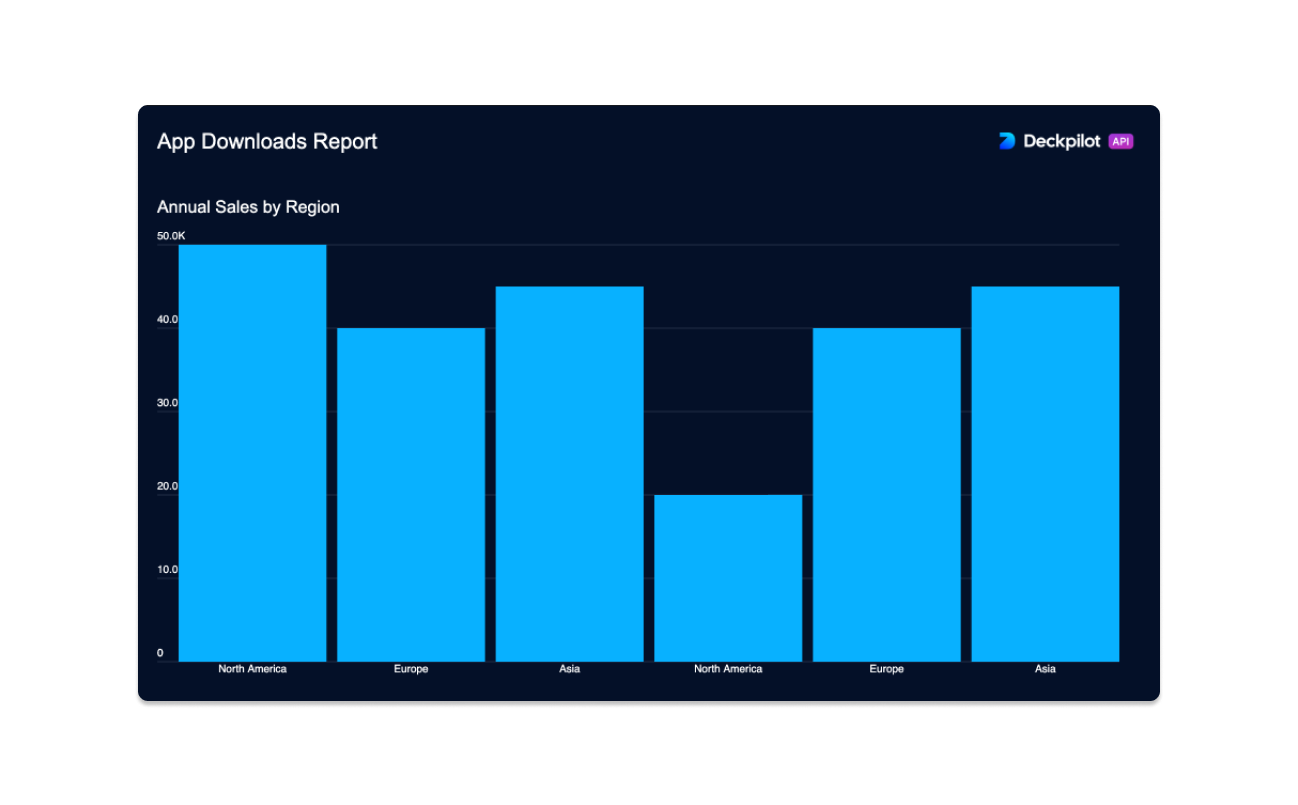
"title": "Annual Sales by Region",
"data": [
{
"label": "North America",
"value": 50000
},
{
"label": "Europe",
"value": 40000
},
{
"label": "Asia",
"value": 45000
}
]
}