Stacked Bar Chart
Illustrates the breakdown of categories into segments by stacking them vertically in a single bar, facilitating the comparison of segment proportions within each category and the total across categories.
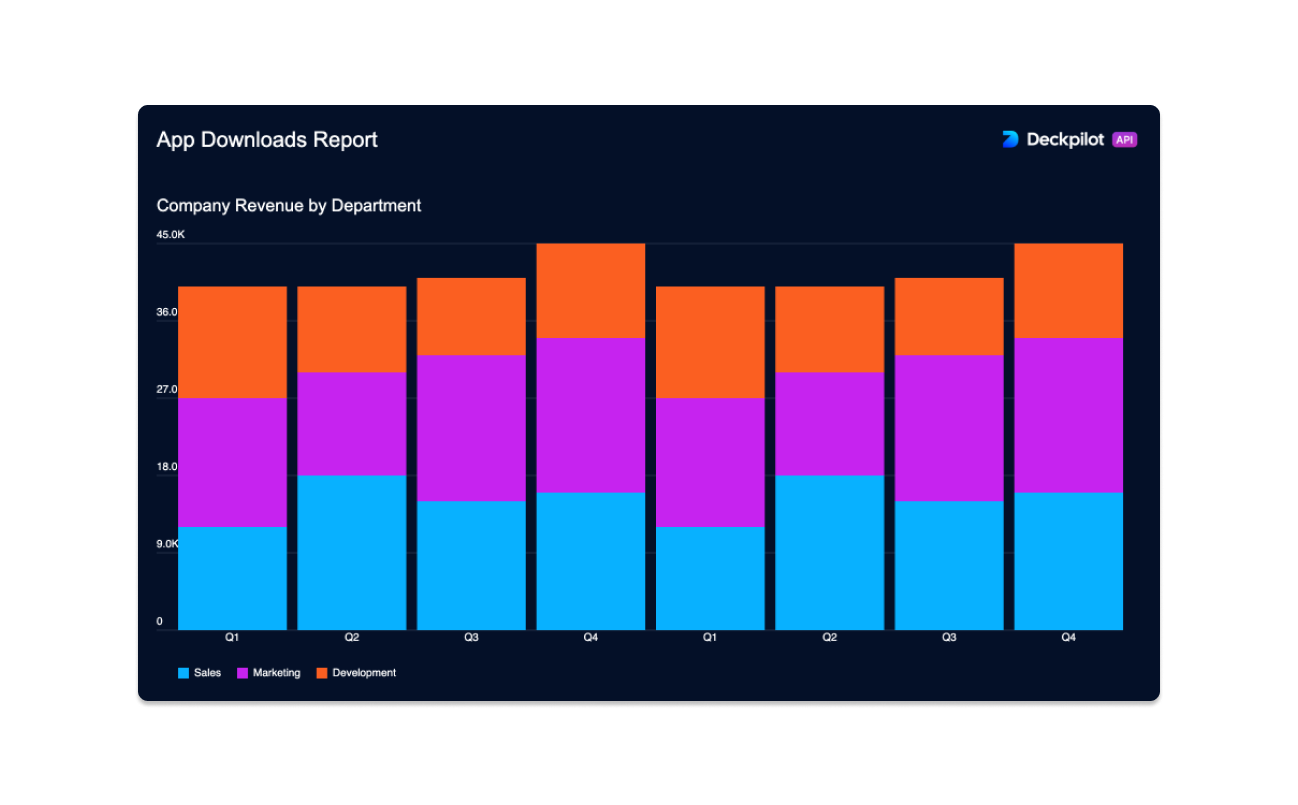
StackedBarChart
Defines the overall structure of a stacked bar chart component within a report.
id- A literal string with the value "stackedBar", identifying the component as a stacked bar chart.title- An optional string representing the title of the stacked bar chart.data- An instance ofStackedBarChartData, representing the categories with their segments to be visualized in the stacked bar chart.segmentLabels- An array of strings representing labels for each segment within the categories. The labels provide context for what each segment represents.
StackedBarChartData
Defines an array of objects, each representing a category with its segments for the stacked bar chart.
label- A string representing the name of the category.segments- An array of numbers representing the value of each segment within the category. The segments are stacked vertically in the bar chart to represent their contribution to the total value of the category.
Example
{
    "id": "stackedBar",
    "title": "Company Revenue by Department",
    "data": [
        {
            "label": "Q1",
            "segments": [12000, 15000, 13000]
        },
        {
            "label": "Q2",
            "segments": [18000, 12000, 10000]
        },
        {
            "label": "Q3",
            "segments": [15000, 17000, 9000]
        },
        {
            "label": "Q4",
            "segments": [16000, 18000, 11000]
        }
    ],
    "segmentLabels": ["Sales", "Marketing", "Development"]
}