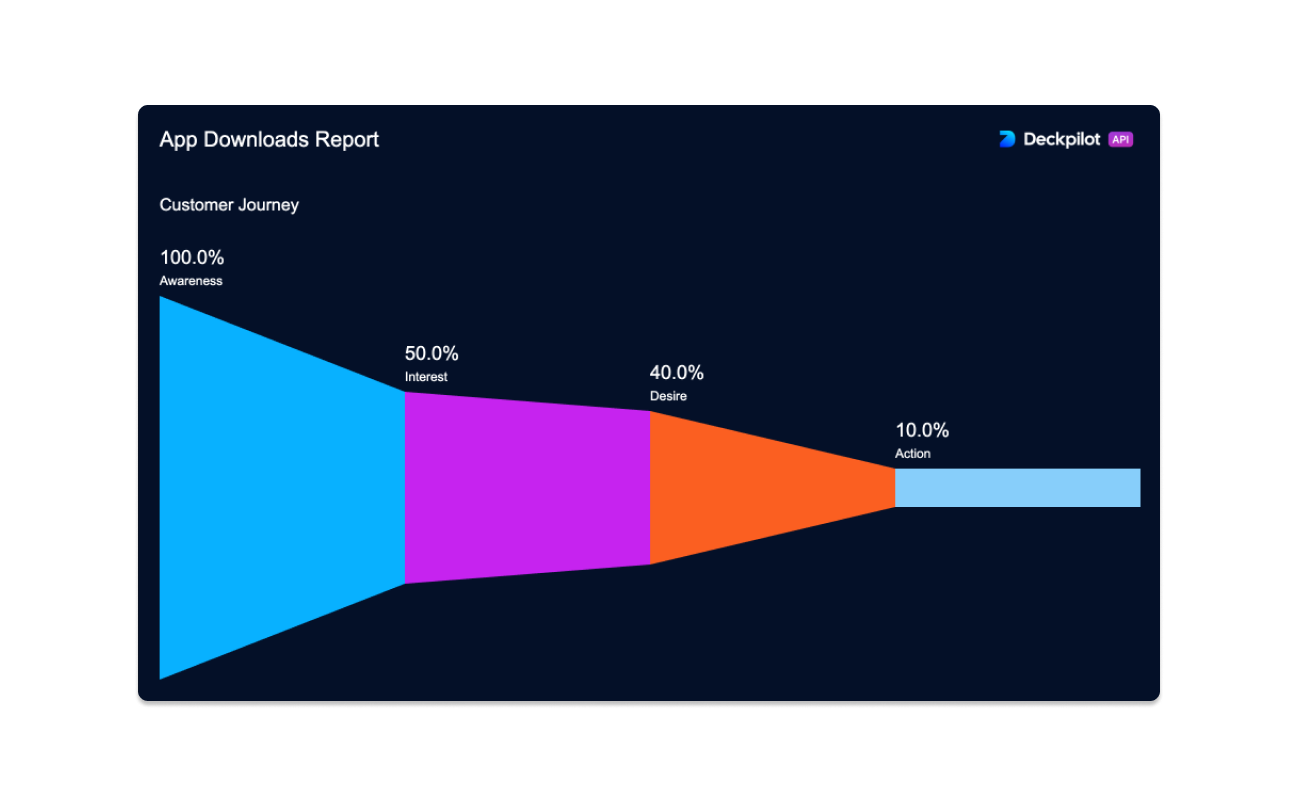
Horizontal Funnel Chart
Depicts the stages of a process or the flow of resources, metrics, or users through different phases, with each stage represented as a horizontal bar whose width corresponds to its value. This visualization helps in identifying bottlenecks or points of interest in a process flow.
HorizontalFunnelChart
Defines the structure of a horizontal funnel chart component within a report.
id- A literal string with the value "horizontalFunnel", identifying the component as a horizontal funnel chart.title- An optional string representing the title of the horizontal funnel chart.data- An instance ofHorizontalFunnelChartData, representing the stages or phases with their corresponding values to be visualized in the funnel chart.
HorizontalFunnelChartData
Defines an array of objects, each representing a stage or phase in the funnel with its associated value.
label- A string representing the name of the stage or phase.value- A number representing the value associated with the stage or phase, indicating its size or importance in the funnel. The number must be greater than or equal to 0.
Example
{
    "id": "horizontalFunnel",
    "title": "Customer Journey",
    "data": [
        {
            "label": "Awareness",
            "value": 1000
        },
        {
            "label": "Interest",
            "value": 800
        },
        {
            "label": "Desire",
            "value": 600
        },
        {
            "label": "Action",
            "value": 400
        }
    ]
}